Find your path to success with a diverse range of more than 120 degree, certificate, and continuing education programs.
In keeping with Institutional Research’s mission to monitor and report on enrollment and demographic trends at Bergen Community College, the Quick Facts section features reports that take the pulse of the College. The Quick Facts documents below provide snapshots that capture basic information about the College during a particular semester, fiscal year, or other time period.
10th Day Enrollment Reports
The 10th Day Enrollment Reports present ten-year trend analyses of enrollments at Bergen Community College. Specifically, these analyses consist of student headcount and credit totals. The trends presented are based on enrollment data generated at the end of the 10th Day for each semester.
- Spring Enrollment Trends 2015 – 2024

- Summer Enrollment Trends 2013-2022
- Fall Enrollment Trends 2015 – 2024
Retention Rate Chart
The retention rate chart calculates the retention rates from semester to semester of first-time, full-time, degree-seeking student cohorts as well as first-time, part-time, degree-seeking student cohorts from Fall 2012 to Fall 2021.
- Retention Rates – Full-Time, First-Time, Degree-Seeking Students
- Retention Rates – Part-Time, First-Time, Degree-Seeking Students
Bergen Facts
Bergen Facts is a one-page summary of financial, enrollment, and success outcomes data, as well as personnel information.
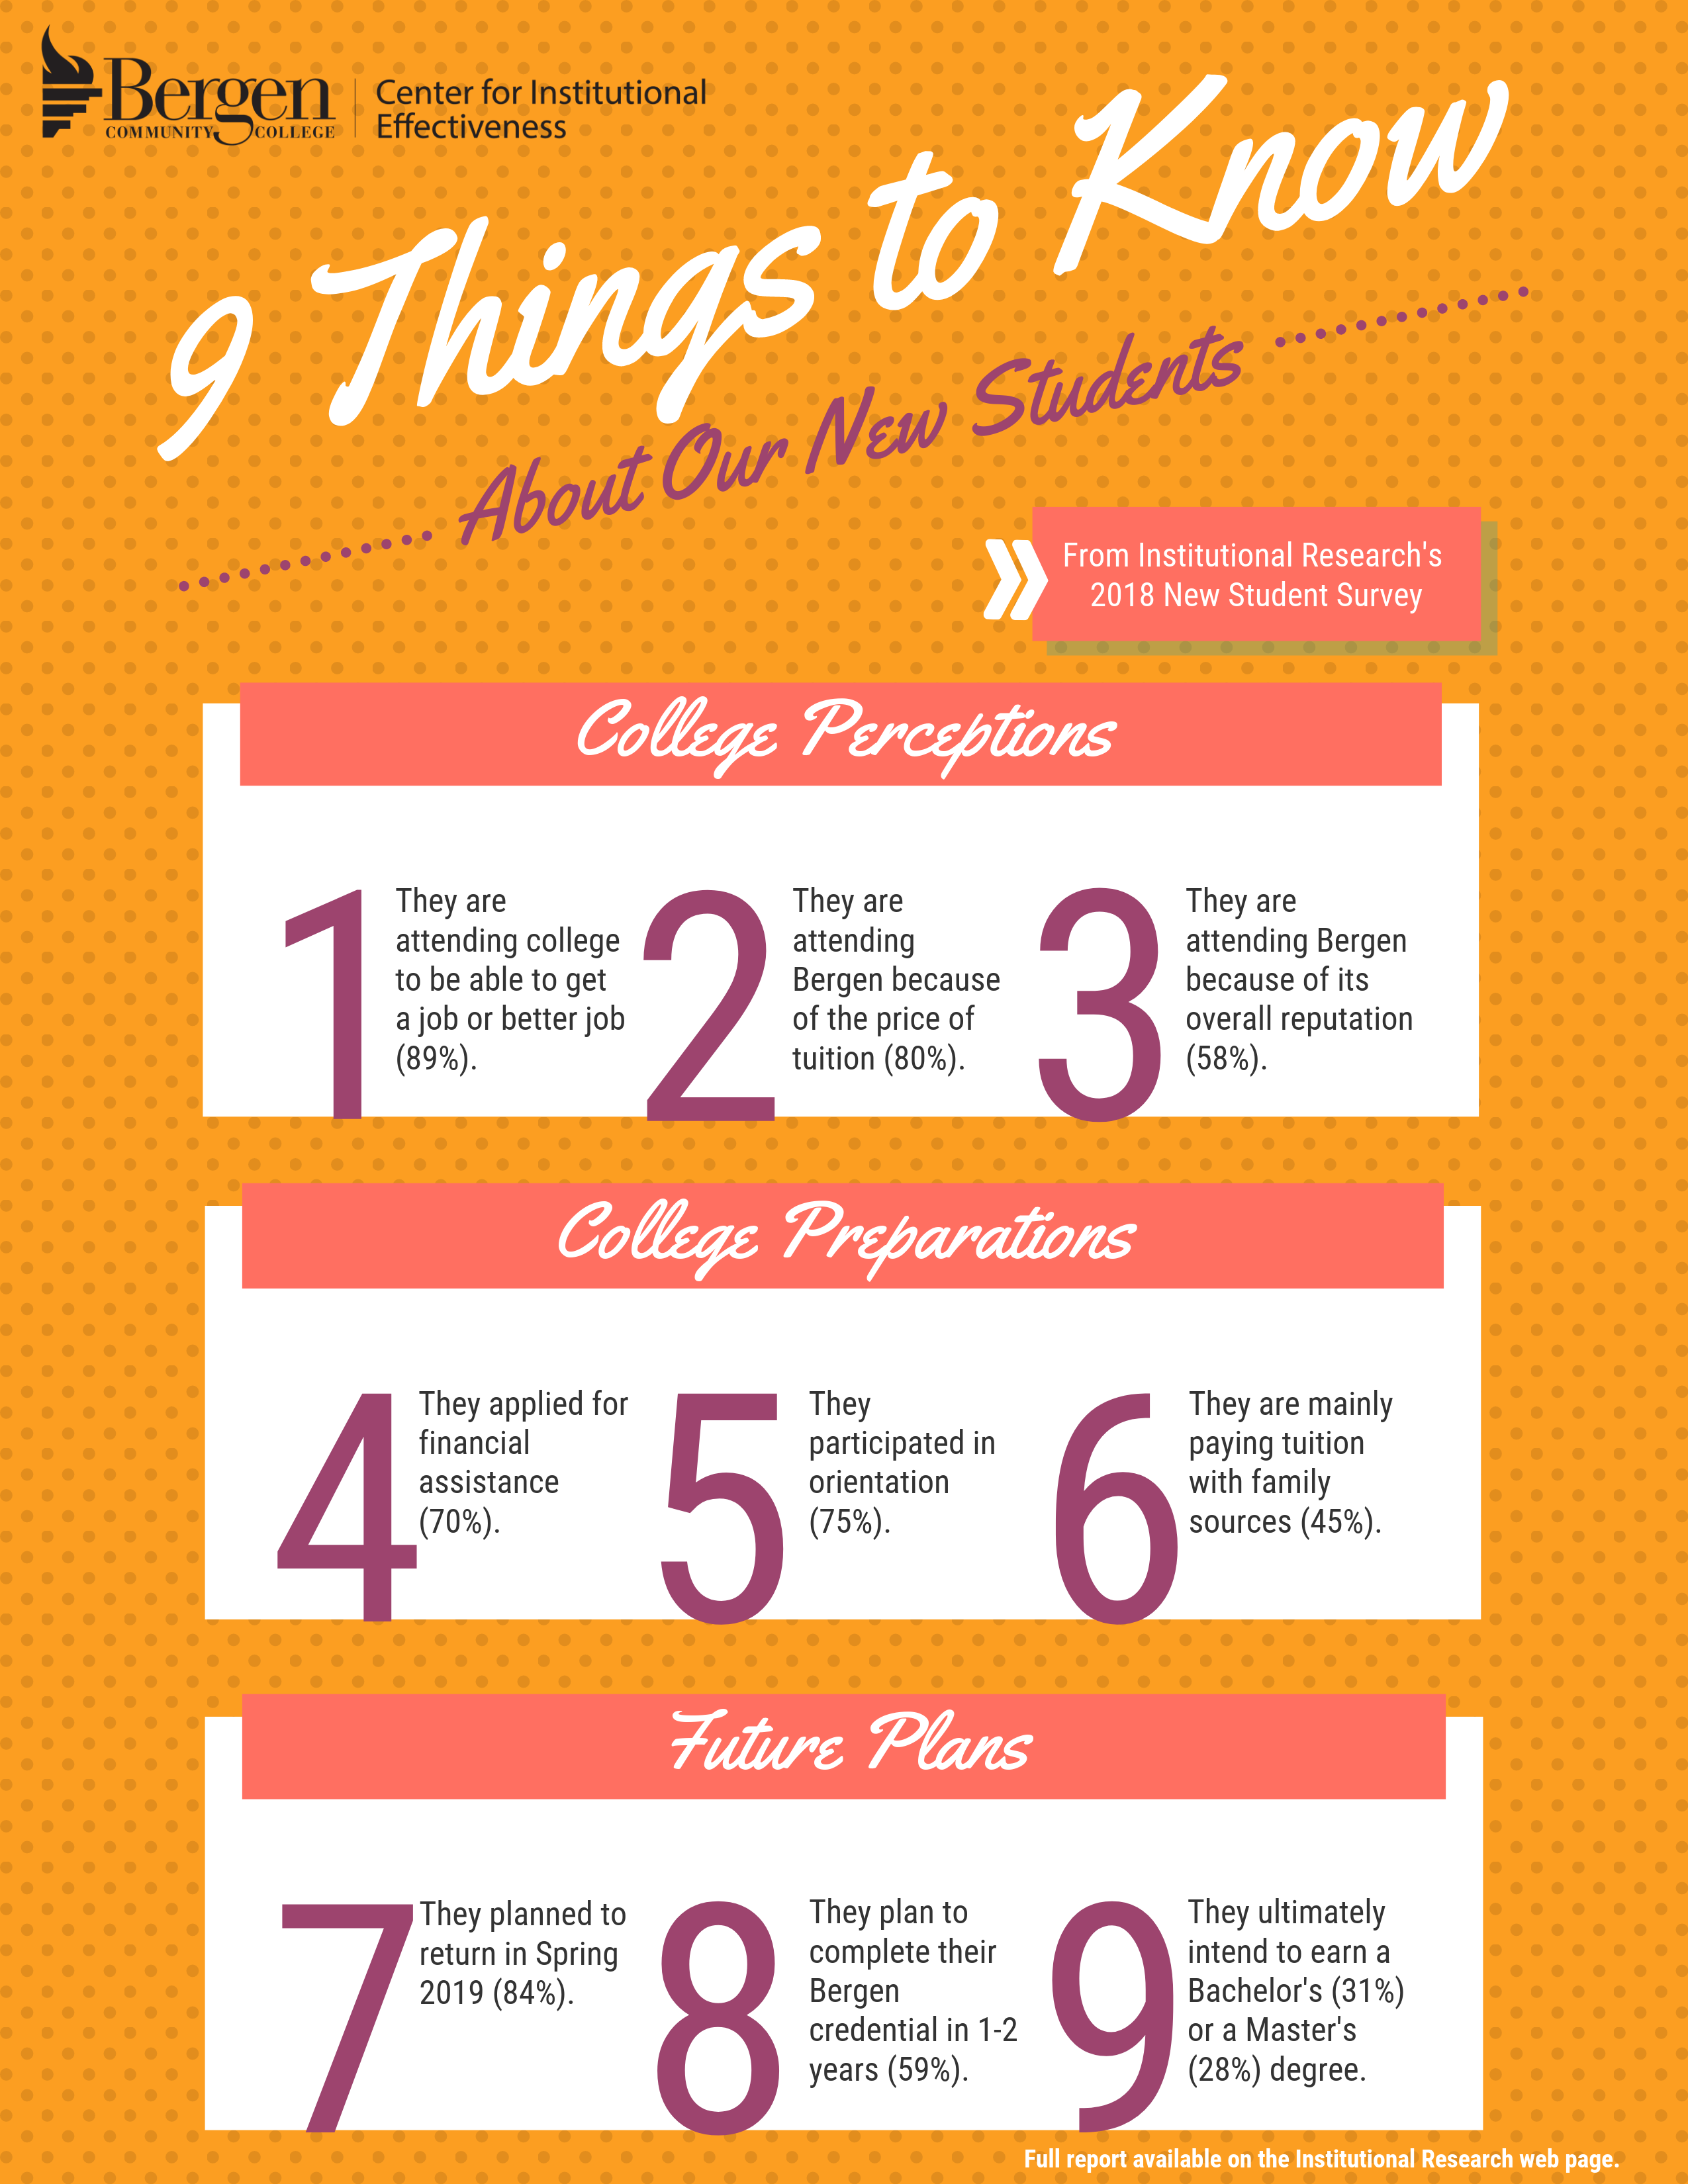
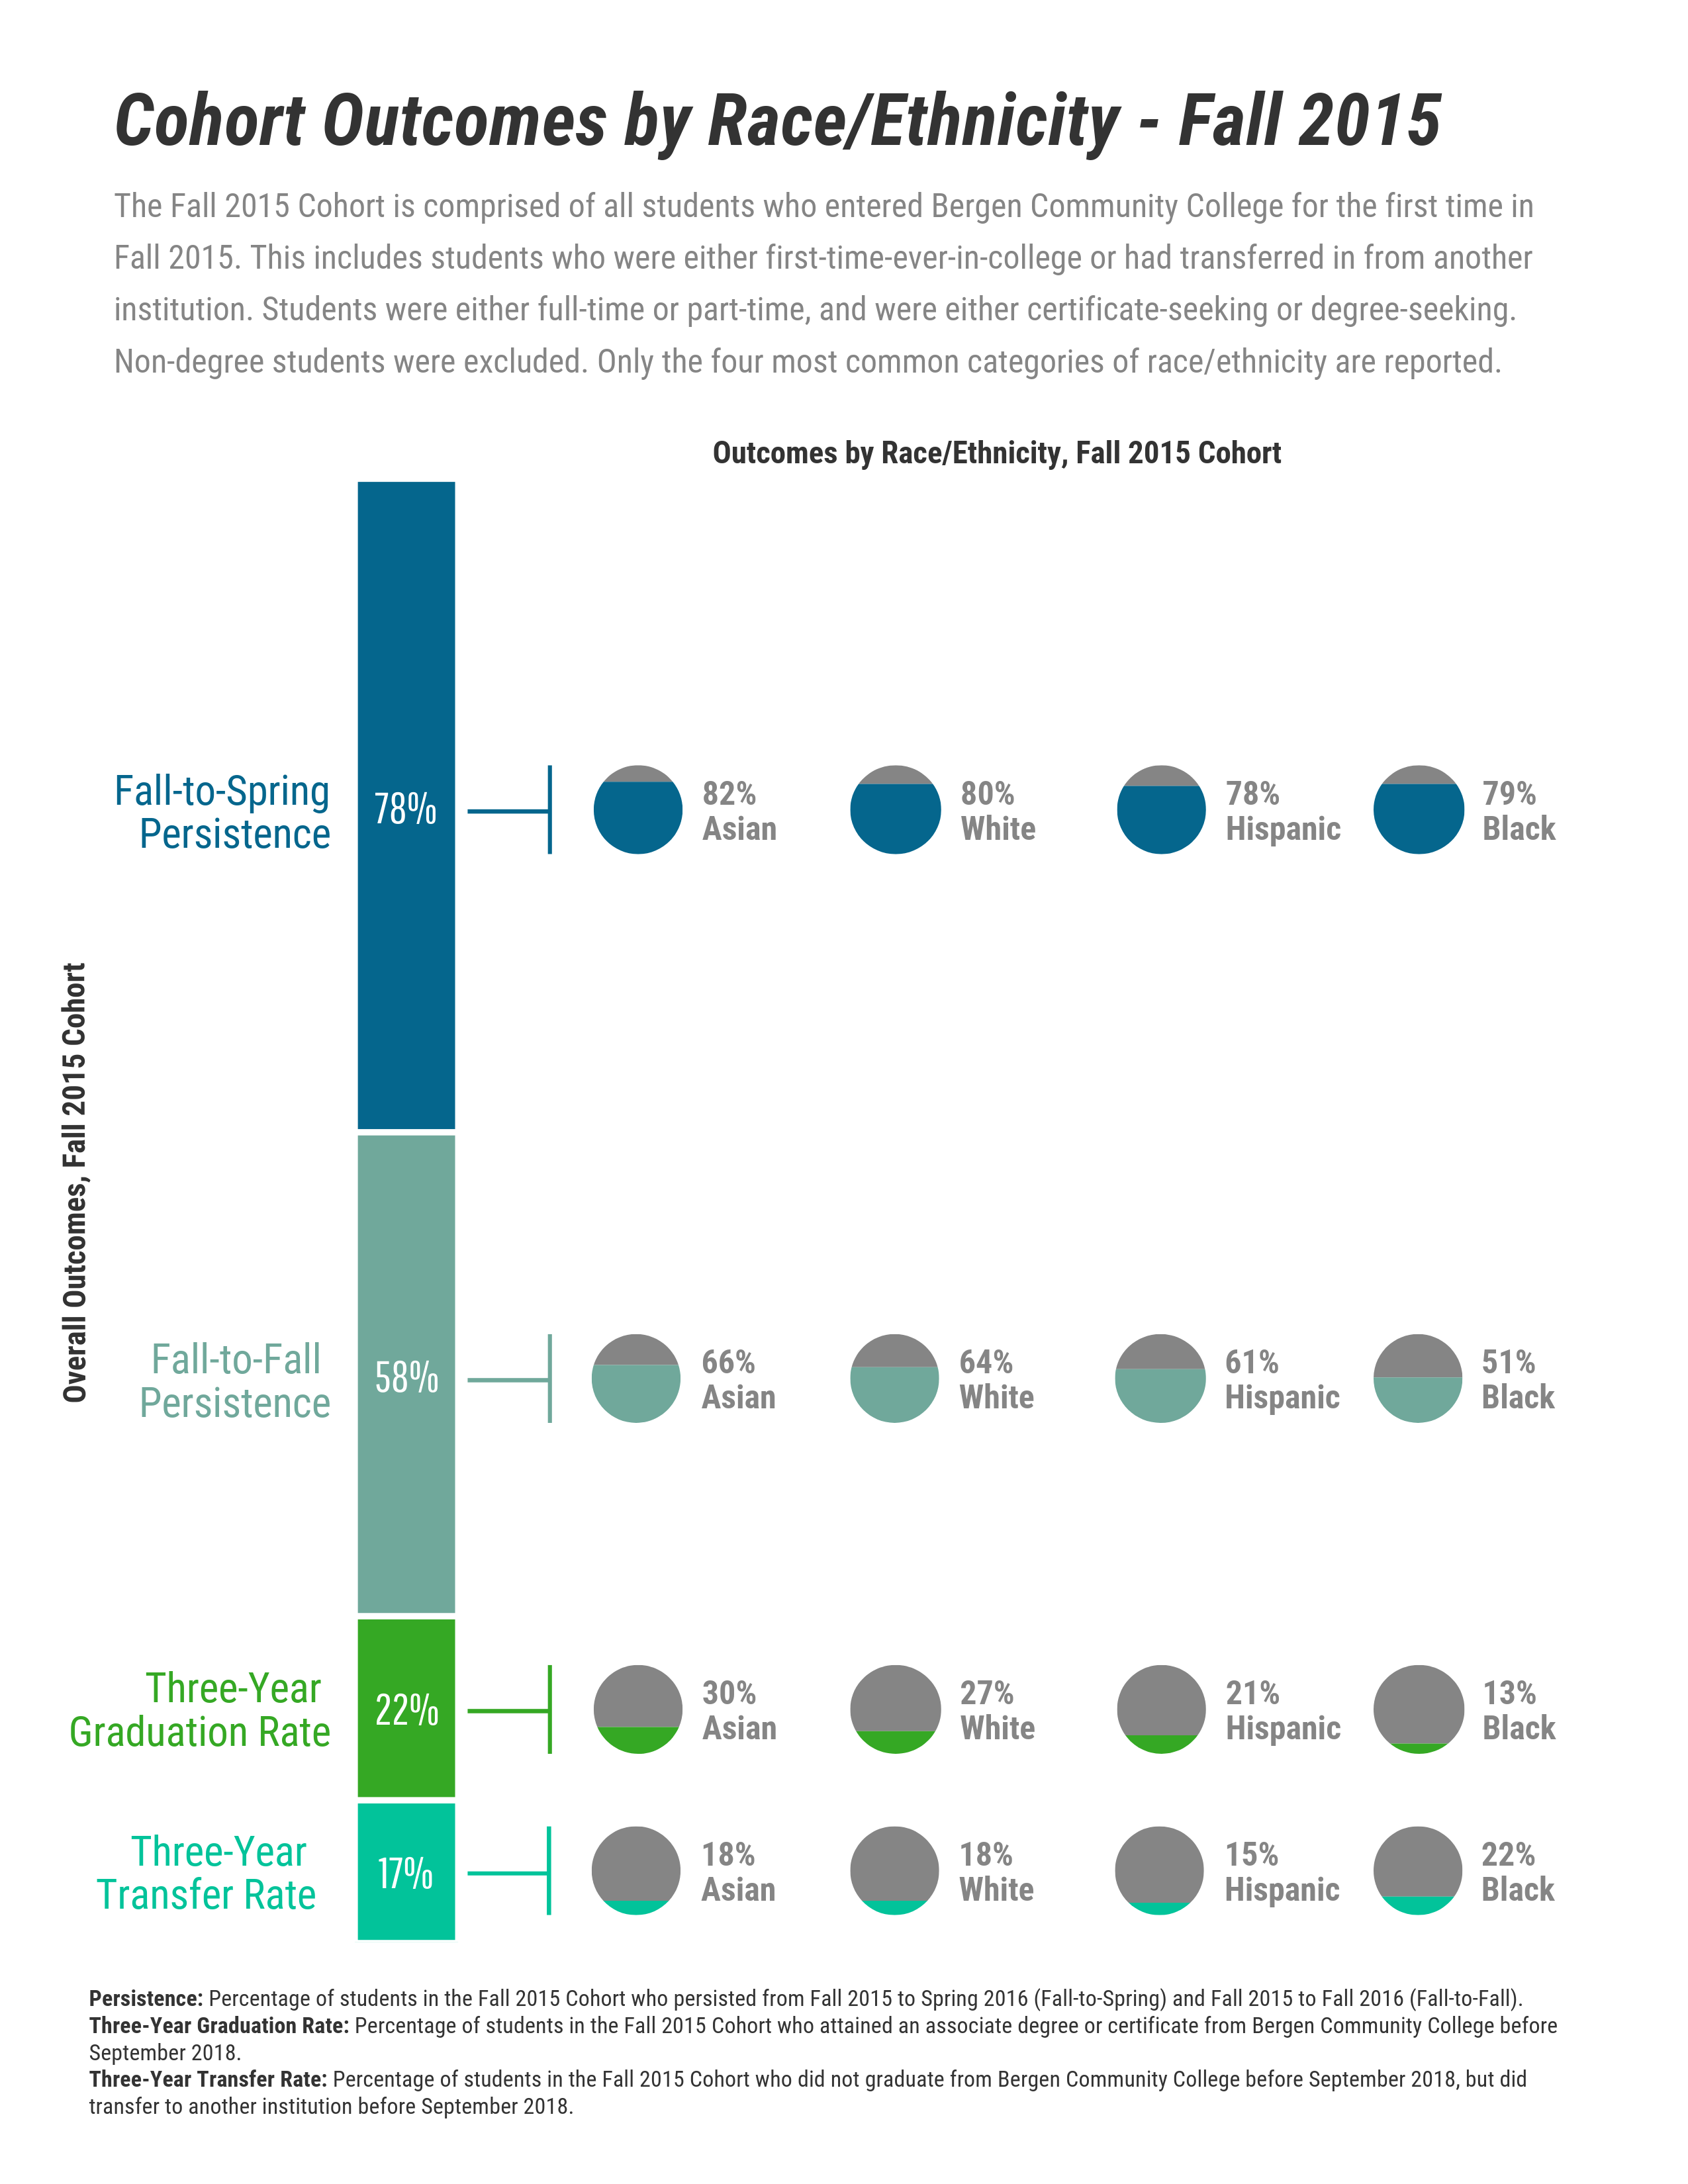
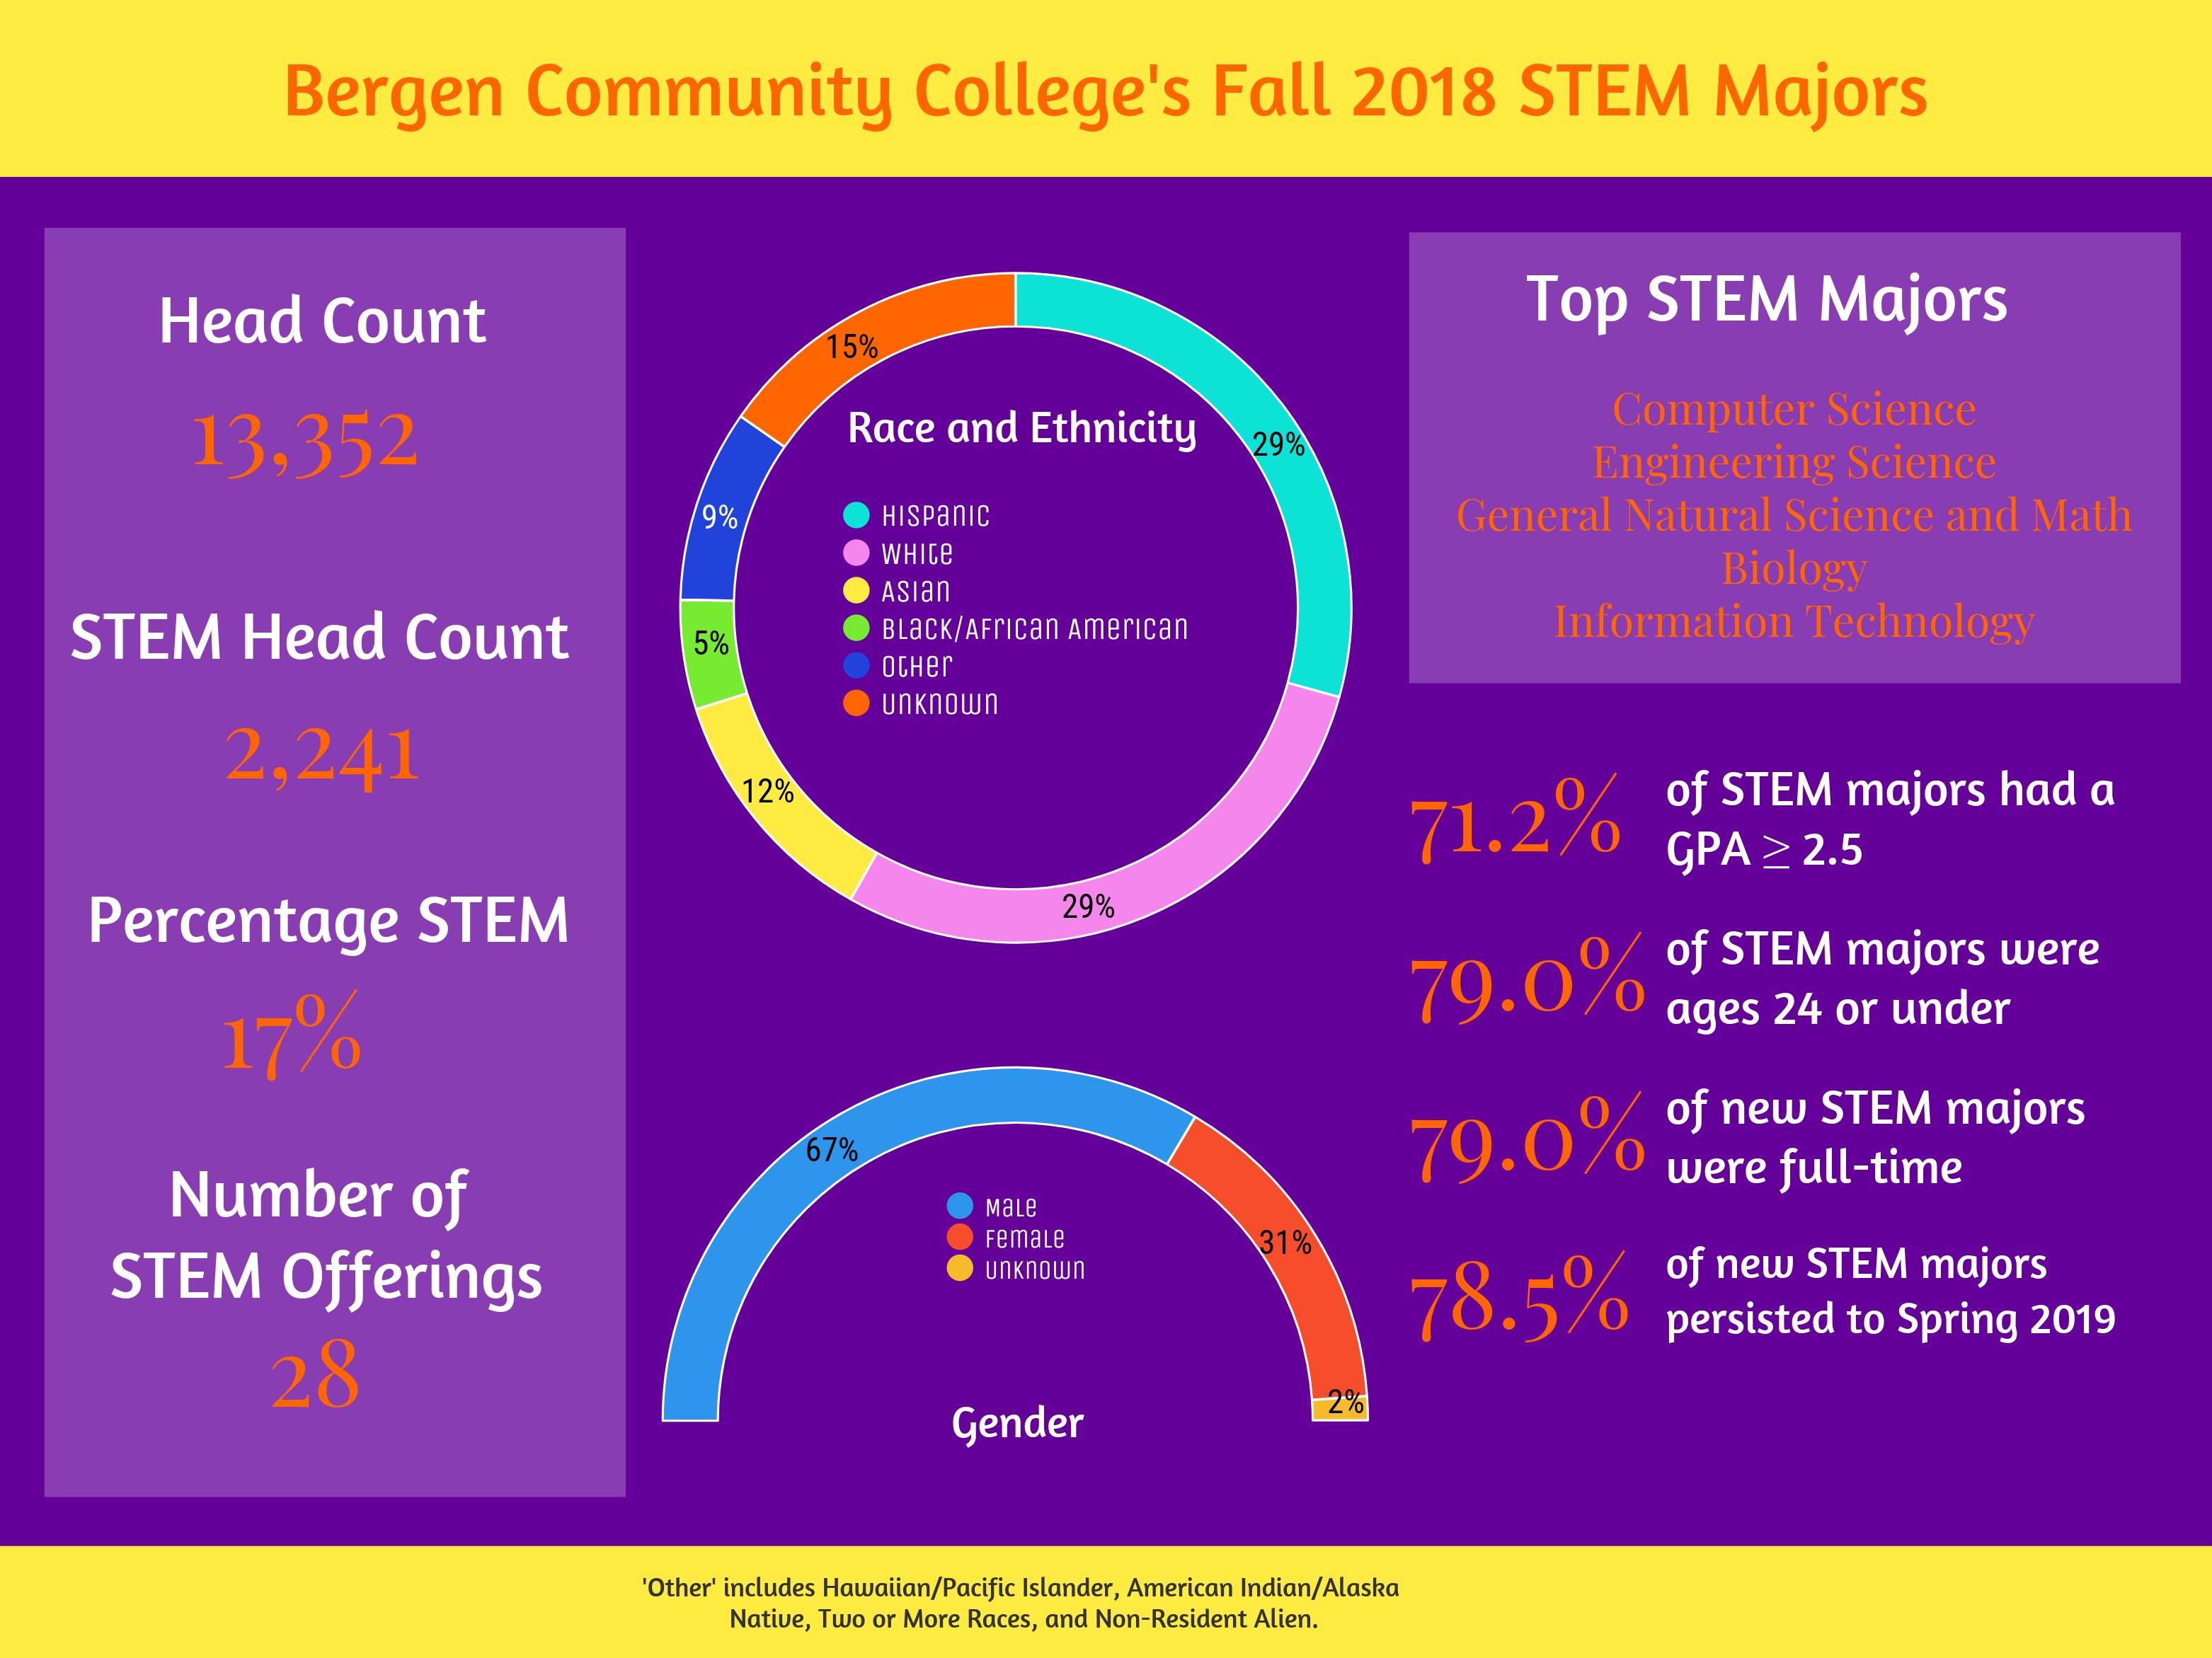
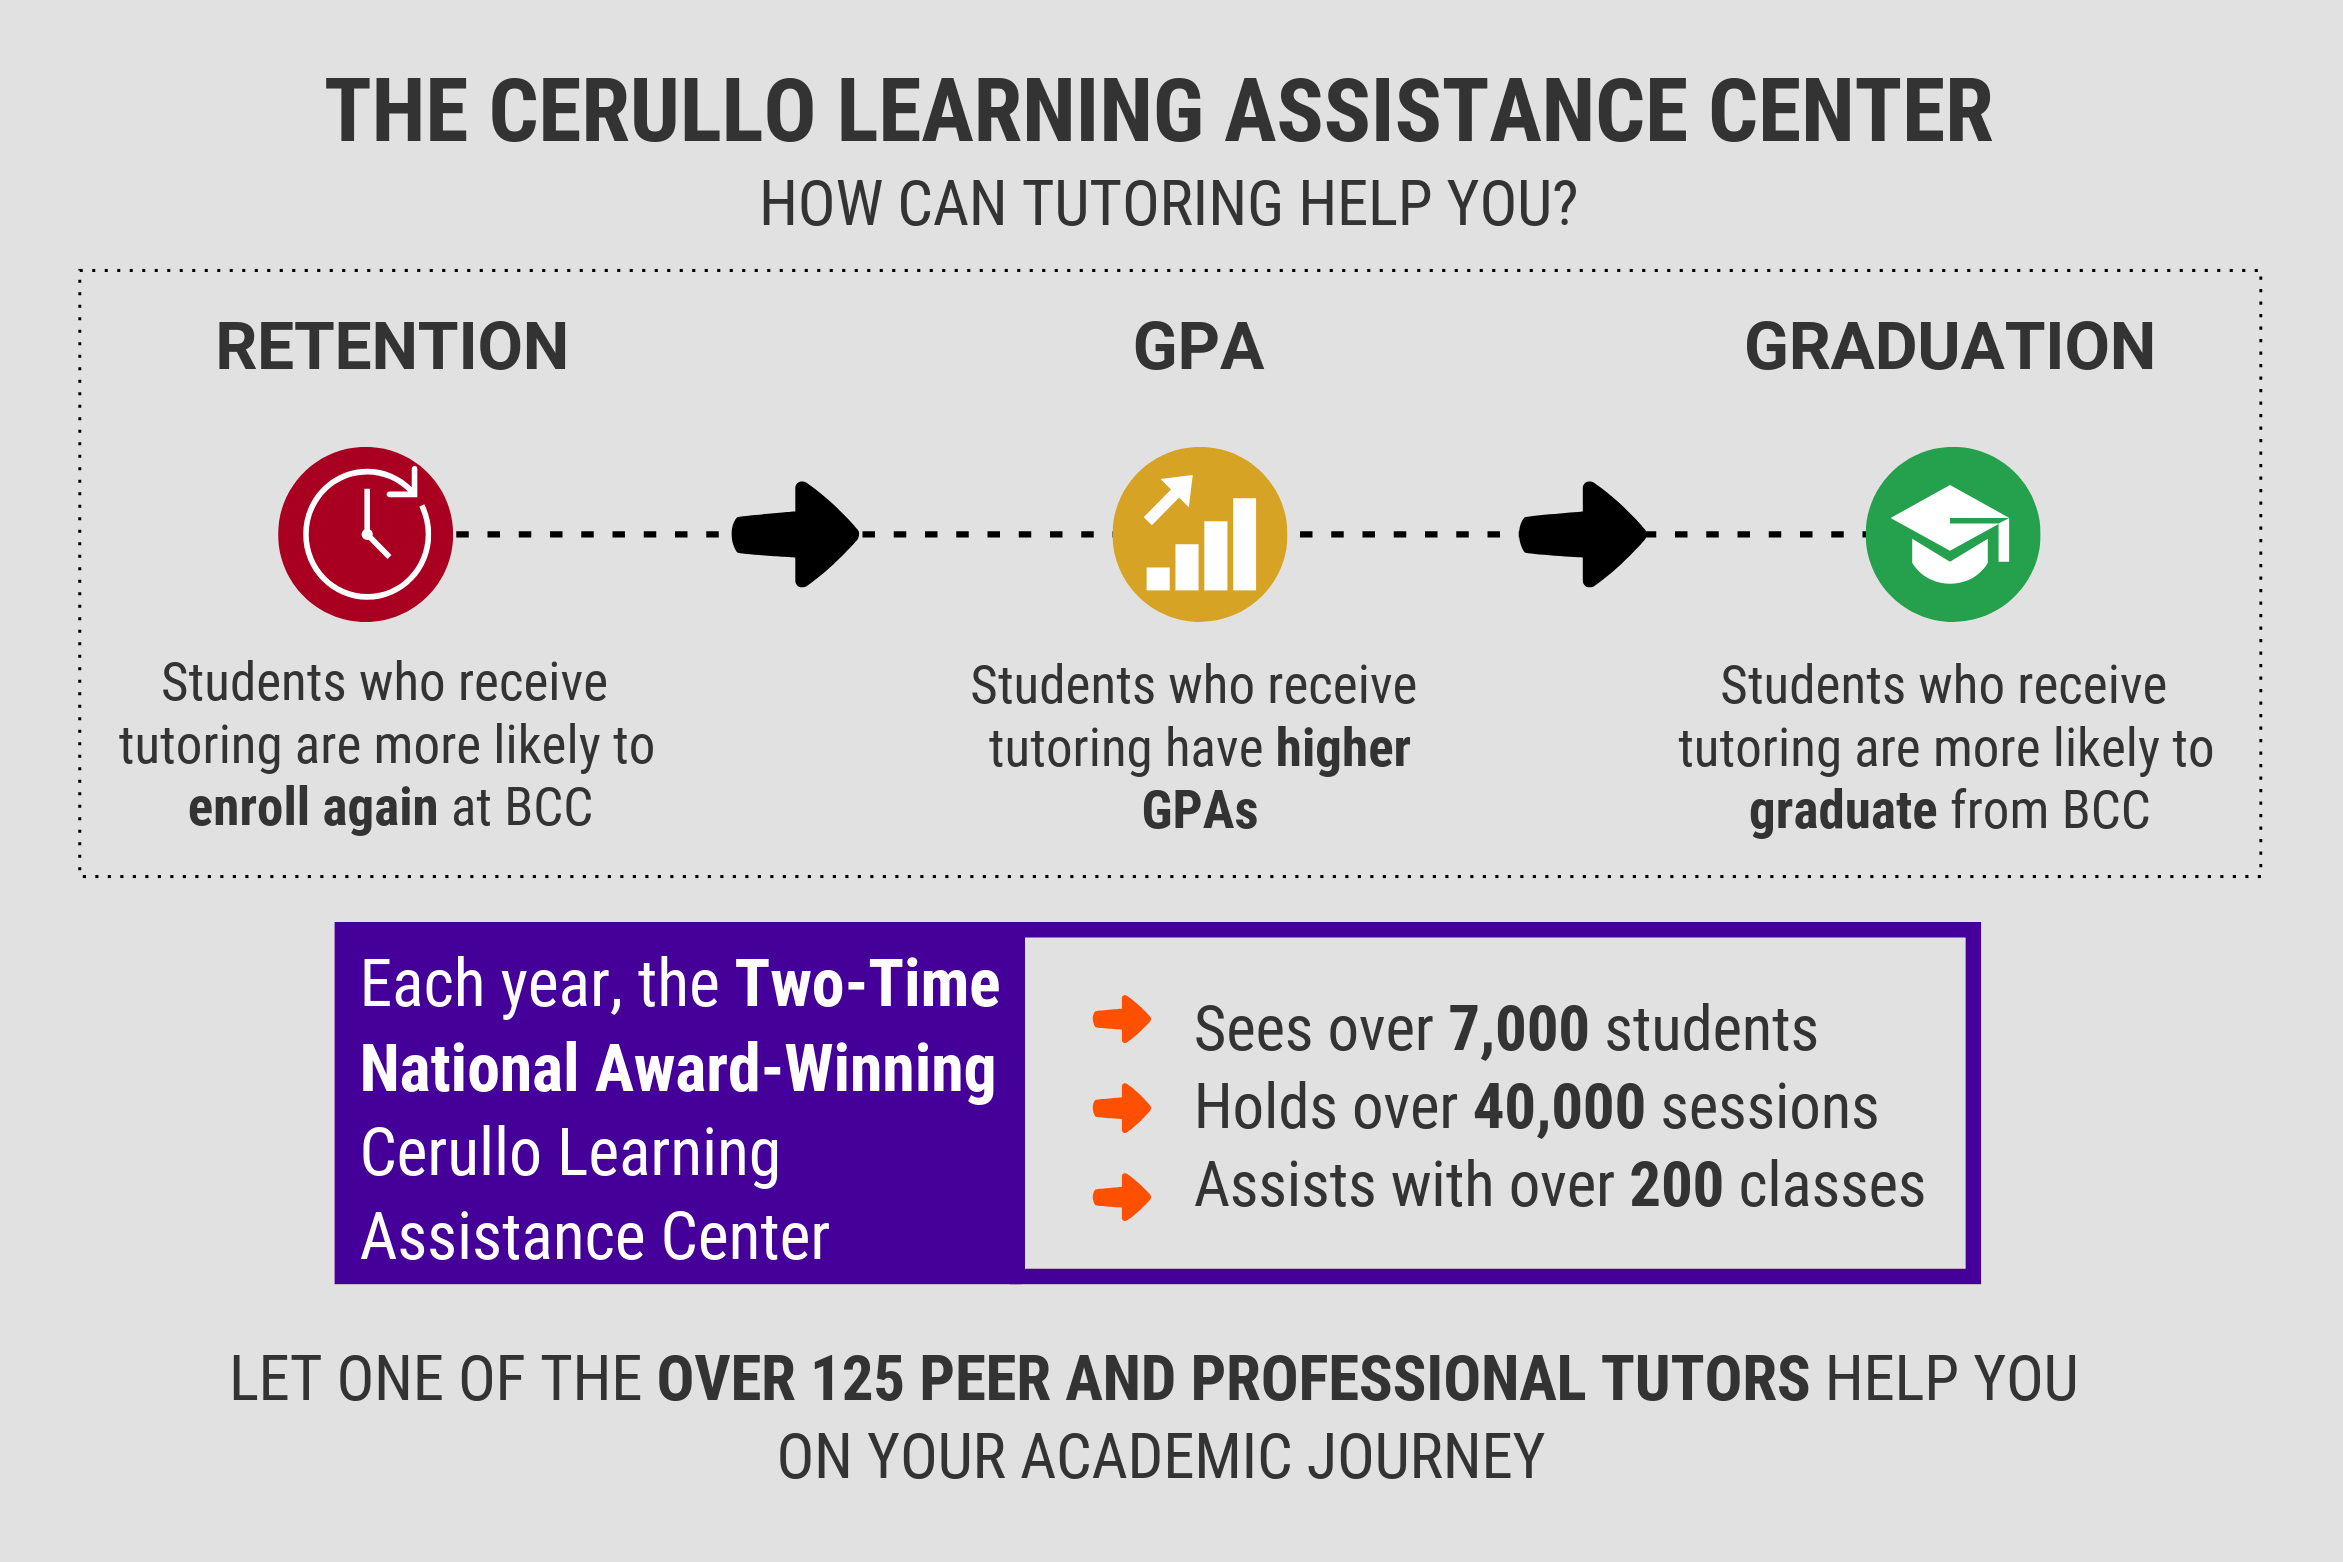
Infographics
The Office of Institutional Research uses Venngage, a data visualization tool, to create RAV reports that present Recycled data in an Accessible and Visually stimulating way. Click through the gallery below to see a sample of Bergen’s RAV Reports.


For Quick Facts documents from previous years, please make a request via the Data Request Form.